A new study has created a Beverage Hydration Index (BHI) showcasing the hydrating capability of 13 everyday fluids. Image courtesy Pixabay.
Chances are you’re familiar with the Glycemic Index (GI) – a relative scale ranking (0-100) how various carbohydrate-centric foods affect blood glucose levels.[1] The lower a food’s GI rating the less it will spike blood sugar levels and affect insulin levels. The problem with the Glycemic Index, and diets based around its premise, is that its ratings are based on foods consumed in isolation.
For example, a piece of white bread has a GI rating of 70 when eaten on its own. However, the glycemic load of a sandwich made of white bread, chicken, cheese, lettuce, tomato, and mustard will have a much lower GI rating due to the inclusion of protein, fat, and fiber. See the problem here?
Classifying a food as “bad” by its GI rating is a little misguided as very rarely will you demolish a whole loaf of bread on its own void of any other macronutrient categories.
Now, a new index has been created. No, we don’t have another food ranking scale, this time we’ve got a Beverage Hydration Index (BHI). A new study recently sought to rank which beverages are best in terms of replenishing lost fluids during the day.
The Study
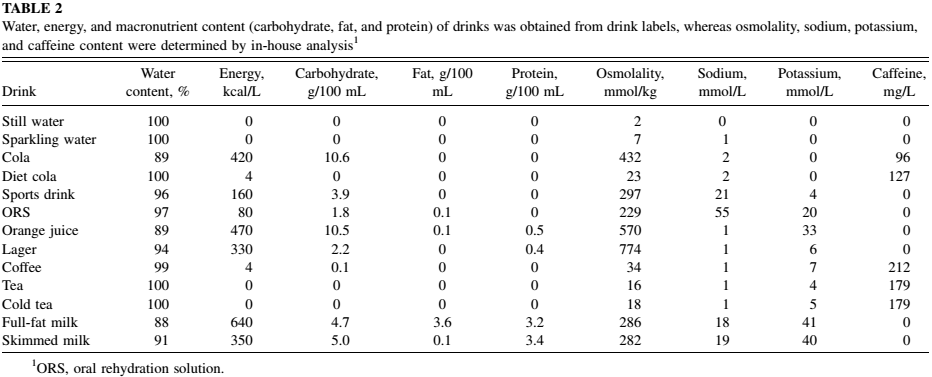
Here are the 13 different fluids used by researchers in the study that documents water content and several other variables.
Sponsored by the European Hydration Institute, the study was a collaborative effort by researchers at the University of Stirling, Loughborough University and Bangor University. The aim of the study was to determine fluid balance responses to the consumption of a set volume of commonly consumed beverages consumed in a euhydrated state (a normal fluid balance). For the study, 72 men, ages 18-35, were enlisted.
Each participant, fasted and euhydrated, consumed four different beverages, water being one of the three for all participants. The group then recorded their diet and exercise during the two days before the first trial and were asked to replicate those same activities before the follow-up visits. It’s worth mentioning that the subjects were asked to avoid strenuous exercise and alcohol in the 24 hours preceding all trials, as this would obviously affect the impact of hydration status..
The “Collection Process”
So, how exactly do you test the hydration-capability of a particular beverage?
Well, to start, each man consumed 500 milliliters of still water over the course of 15 minutes, one hour prior to arriving at the laboratory. Once at the lab, they were instructed to use the bathroom and then have their corresponding baseline body weight measurements recorded. Following this, participants ingested one liter of a particular “test drink” over a 30-minute period (four equal servings administered 7.5 minutes apart). Afterwards, they were again instructed to empty their bladder post-ingestion and yet again at the end of each hour for the next four hours….lots of trips to the bathroom!
What Drinks Were Tested?
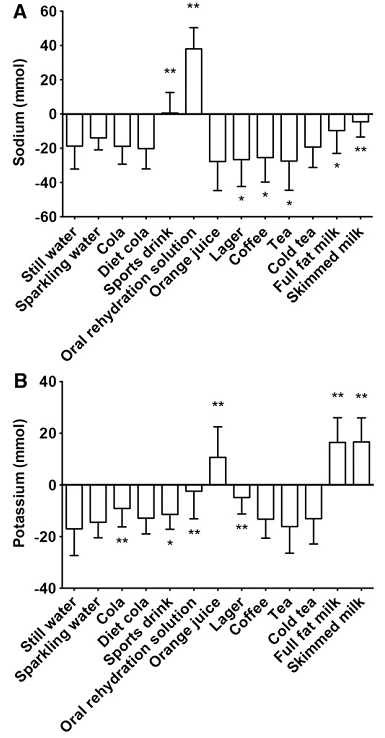
These graphs show Sodium (A) and potassium (B) net balances 2 h after ingestion of 1 L of various commonly consumed and commercially available
drinks.
In all, 13 of the most common beverages consumed were used by the study’s authors. Those beverages were:
- Still water
- Sparkling water
- Coca-Cola
- Diet Coke
- Sports drink (Powerade)
- Oral rehydration solution (Dioralyte)
- Orange juice
- Lager beer (Carlton)
- Hot black coffee
- Hot black tea
- Cold black tea
- Full-fat milk
- Skim milk
Now, we know what you’re thinking. Each beverage has a different amount of water. Obviously, full-fat milk has less water in an equivalent volume of plain water due to the presence of carbs, fats, and proteins.
Researchers were well aware of this going into the study and presented the results using both corrected and uncorrected values for the differences in water content, as everyday use would dictate the uncorrected values.
Determining the BHI
To calculate the BHI of a given beverage, researchers divided the urine mass after consuming still water by the urine mass for each test beverage. If that sounds a little complicated, basically a high BHI means more water is retained in the body than if the drinker had drank an equal volume of still water. High BHI = Excellent Hydration Beverage
The Results
Here’s where some surprises may come. Most of us are always told to “drink more water” because it’s the best means of hydrating the body. However, the group of researchers found a little something different as you’ll see in the graph:
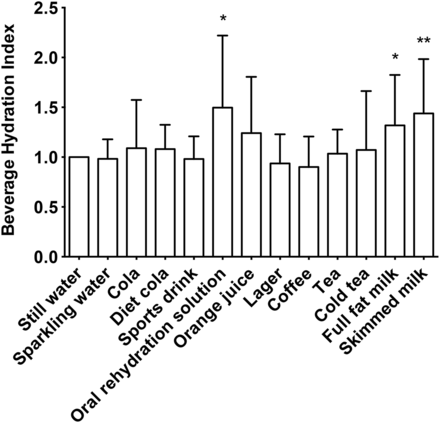
Here is the BHI after correcting for water content of the various fluids. Surprisingly, water isn’t the most “hydrating” fluid.
Urine output following the ingestion ofthe oral rehydration solution, skim milk, and full fat milk was lower than that from ingestion of still water, meaning those beverages have a higher hydration index than water.
Water was used as a control and assigned a value of 1.0 on the BHI. Due to the varying water content of the drinks, which ranged from 88 to 100 percent, the BHI was calculated with and without an adjustment for the amount of water contained in each drink.
Using non-corrected values, a hydration index that was higher than water was observed for skim milk (1.58), oral rehydration solution (1.54), full-fat milk (1.50), and orange juice (1.39).
However, after correcting for water content only the oral rehydration solution (1.50), skim milk (1.44), and full-fat milk (1.32) significantly greater than water.
Most surprisingly, coffee isn’t as dehydrating as some would have you think. As you’ll see in the graph, it’s not that much lower than water on the BHI scale. A minor victory for the coffee addicts out there!
Takeaway
So, have we gleaned any huge, earth-shattering news from this study? No, not really. We already knew that water was good at hydrating us, as is milk due to the electrolytes contained in it.
This does good some firepower to those who were always reprimanded for drinking coffee, tea, diet soda in place of water, as there were no significant differences in hydration between any of those. Now, this doesn’t mean you should subsist on a diet of Coke and Starbucks Iced Coffee. But it doesn’t mean you have to freak out about always carrying a bottle of water to chug anytime you consume a beverage that isn’t 100% pure water.
The end of the day the study is interesting and useful for some, but for most it was pretty much common sense.

Comments and Discussion (Powered by the PricePlow Forum)