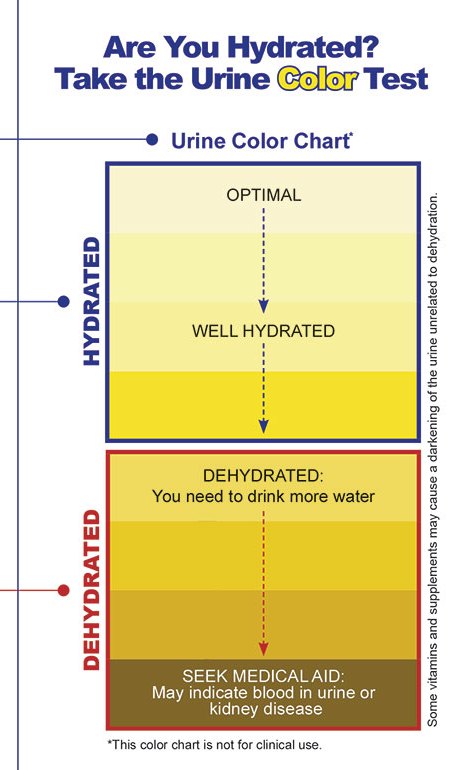
Here’s an image you’ll find posted inside various US Military bathrooms for people to check on their hydration levels.
Water: the essential nutrient of all life on earth. Without it, you wither away a die just like an unwatered bed of flowers. With it though, you can live a long, happy, and healthy life (provided you’re eating quality proteins and staying away from too much sugar and omega-6 seed oils).
We’ve all been in the bathroom on occasion and seen a dark yellow or light brown liquid come out, and probably realized “oh crap, that’s not normal.” And you’re right, it means you’re seriously needing more water.
However, just how much water do you need to drink to see a significant change in urine color? And does that even matter?
Is 1-2 glasses good enough, or should I go a grab a 5% gallon jug and slam the whole thing?
We finally have the answer! A new study published in the European Journal of Nutrition sought to find out just how much water the average adult needs to noticeably improve their pee color.[1]
Ready to take a journey on the yellow river?
Let’s GO!
The Study
If your urine is too dark, you need to drink at least one liter of water to have a noticeable change in color and overall hydration status
The study primarily looked to investigate two specific issues:
- The first was to determine the change in daily fluid intake volume needed to adjust Urine Color (UCol) by 2 shades based on Armstrong’s 8-color scale.[2]
- The second aim of the team was to investigate whether starting UCol (dark vs. moderate) changed the requisite amount of fluid needed to facilitate a change in Ucol.
Diverse subjects
For the study, the team of researchers recruited 238 subjects (50/50 split male and female), with a wide range of daily total fluid intake (TFI). The various TFIs among the group ranged from 0.37–3.22 L/d, which represents the 5th to 95th percentile of TFI.
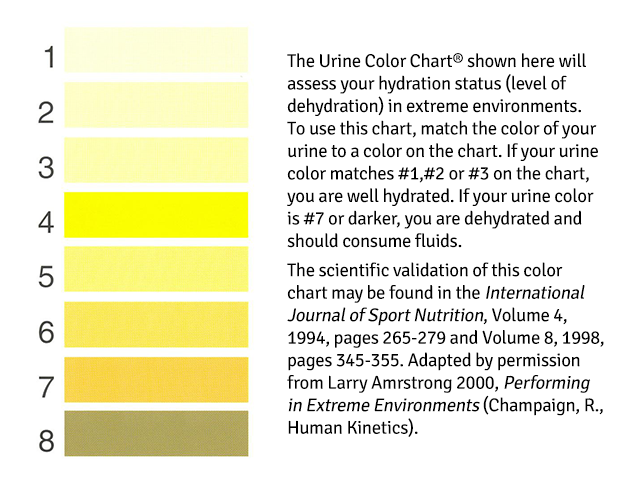
Here’s the ground breaking Urine Color Chart from Dr. Armstong. What’s your number?
Additionally, the participants were either sedentary or participated in only light-to-moderate physical activity (no extreme CrossFitters here). In the cases where individuals were physically active, exercise logs were maintained to ensure that physical activity was within the prescribed limits (average duration of 25 ± 18 min/session).
In total, four different studies were performed on the group that aimed to include variety of study settings, interventions:
- increasing daily TFI in low drinkers,
- decreasing daily TFI in high drinkers,
- or maintaining daily TFI habits, and
- drinking habits representative of typical adults.
See the figure to the right for a clearer understanding of the various trials.[1]
Diverse data collection methods
Different methods for gathering data also varied between the studies.

Meet Lawrence E. Armstrong, Ph.D, the “inventor” of the Urine Color Chart. A true hero.
- In studies A and C, fluid intake data were collected via an online food and fluid intake diary.
- Study B used an inpatient setting, meaning that food and water consumption was controlled, administered, monitored, and recorded by the attending staff.
- In Study D, subjects filled out daily paper food and fluid diaries.
Finally, caffeine intake of ≤500 mg/day was permitted in 3 of the 4 studies.
The Results
In all four studies, urine samples were collected over a 24 hour period and compared to the Armstrong 8-shade urine color scale.[3] Each urine container was placed against a plain white background in a well-lit room where the color of the sample was compared against the color scale. From there, the researchers recorded the number corresponding to the closest shade (1 = very pale; 8 = very dark).
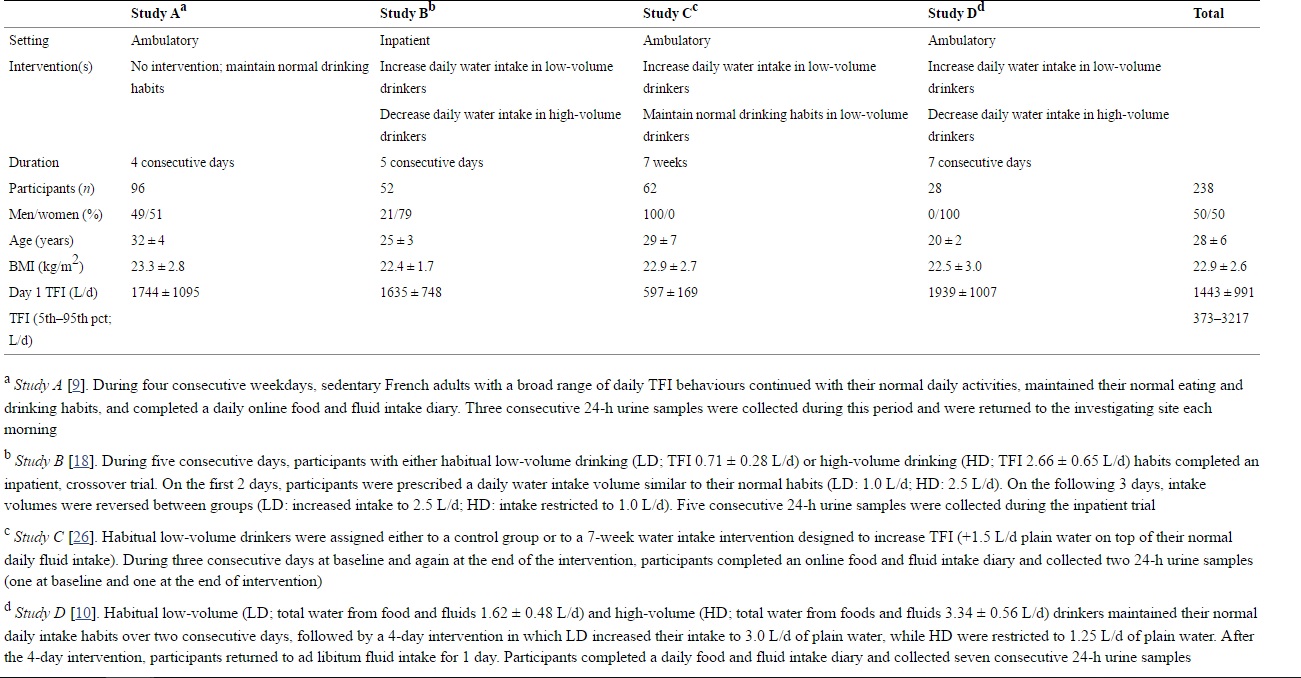
This first table shows the four different studies that were compiled as part of the Urine Color trial.
Researchers saw that a change in urine color by two shades can be achieved with a significant change (1100–1300 mL/day) in daily water intake. Furthermore, the change in daily water intake and the change in urine color shades also noted corresponding changes in urine volume (1.0 L/d) and specific gravity (0.008 units), respectively.
The results suggest a quantifiable relationship between a change in daily water intake and the resultant change in urine color. Basically, if your urine is too dark, you need to drink at least one liter of water to have a noticeable change in color and overall hydration status.
Takeaway
As coach used to say, “If your pee ain’t clear, then you’re dehydrated!” While that may not have been 100% true, it also wasn’t too far off the mark.
Throwin a #7 in the Armstrong chart? Then you better get your Gallon Jug back in action!
Most of us are aware of the fact that water is not only an important nutrient to get daily, it’s also essential for proper health and basic human survival. This study didn’t reveal anything earth shattering by far, but it helped to quantify just how much water you need to aim to get if your urine is a little on the dark side.
Bottom line is DRINK YOUR WATER, FOLKS! Now here’s the kicker – if you’re a low-carb, meat-heavy dieter, and you’re not overcooking your meats… you might not need as much water as you once did. But let the color be the guide.
Water keeps everything in the body operating more efficiently, the only side effect (assuming you don’t grossly overdose) is that you may have to pee more during the day, but that’s a small tradeoff for good health!
References
- Perrier ET, Johnson EC, McKenzie AL, Ellis LA, Armstrong LE. Urine colour change as an indicator of change in daily water intake: a quantitative analysis. European Journal of Nutrition. 2016;55:1943-1949. doi:10.1007/s00394-015-1010-2.
- Armstrong LE, Maresh CM, Castellani JW, Bergeron MF, Kenefick RW, LaGasse KE, Riebe D. Urinary indices of hydration status. Int J Sport Nutr. 1994;4:265–279.
- Armstrong LE. Performing in extreme environments. Champaign: Human Kinetics; 1999.